HAProxy
Adding HAProxy services
You can collect metrics from HAProxy on a node when:
-
There is already a configured haproxy instance.
- After HAProxy is running (default address http://localhost:8404/metrics) you can add it to PMM.
-
Use the
haproxyalias to enable HAProxy metrics monitoring. -
There is already a PMM Agent instance running.
-
This node has been configured using the
pmm-admin configcommand.
USAGE
pmm-admin add haproxy --listen-port=8404
where listen-port is the port number where HAProxy running. (This is the only required flag.)
The output of this command should look as follows:
HAProxy Service added.
Service ID  : /service_id/c481183f-70a2-443f-91e5-cae5cecd06a2
Service name: Ubuntu-haproxy
Additionally, one positional argument can be appended to the command line flags: a service name to be used by PMM. If not specified, they are substituted automatically as <node>-haproxy.
During adding here is connection check (can be skipped by flag --skip-connection-check). If HAProxy doesn’t run properly on the given port then you will see an error message:
Connection check failed: Get "http://127.0.0.1:8404/metrics": dial tcp 127.0.0.1:8404: connect: connection refused.
Beside positional argument shown above you can specify service name with the following flags: --username, --password, --metrics-path (path for scraping metrics, default: /metrics) and --scheme (http or https). Here are some examples:
pmm-admin add haproxy --listen-port=8404 --username=pmm --password=pmm new-haproxy
pmm-admin add haproxy --listen-port=8404 --metrics-path=/prom-metrics --scheme=https
Here you can check list of all available flags: pmm-admin.
You can also add HAProxy by UI in Grafana: Select Configuration → PMM Inventory → Add Instance.
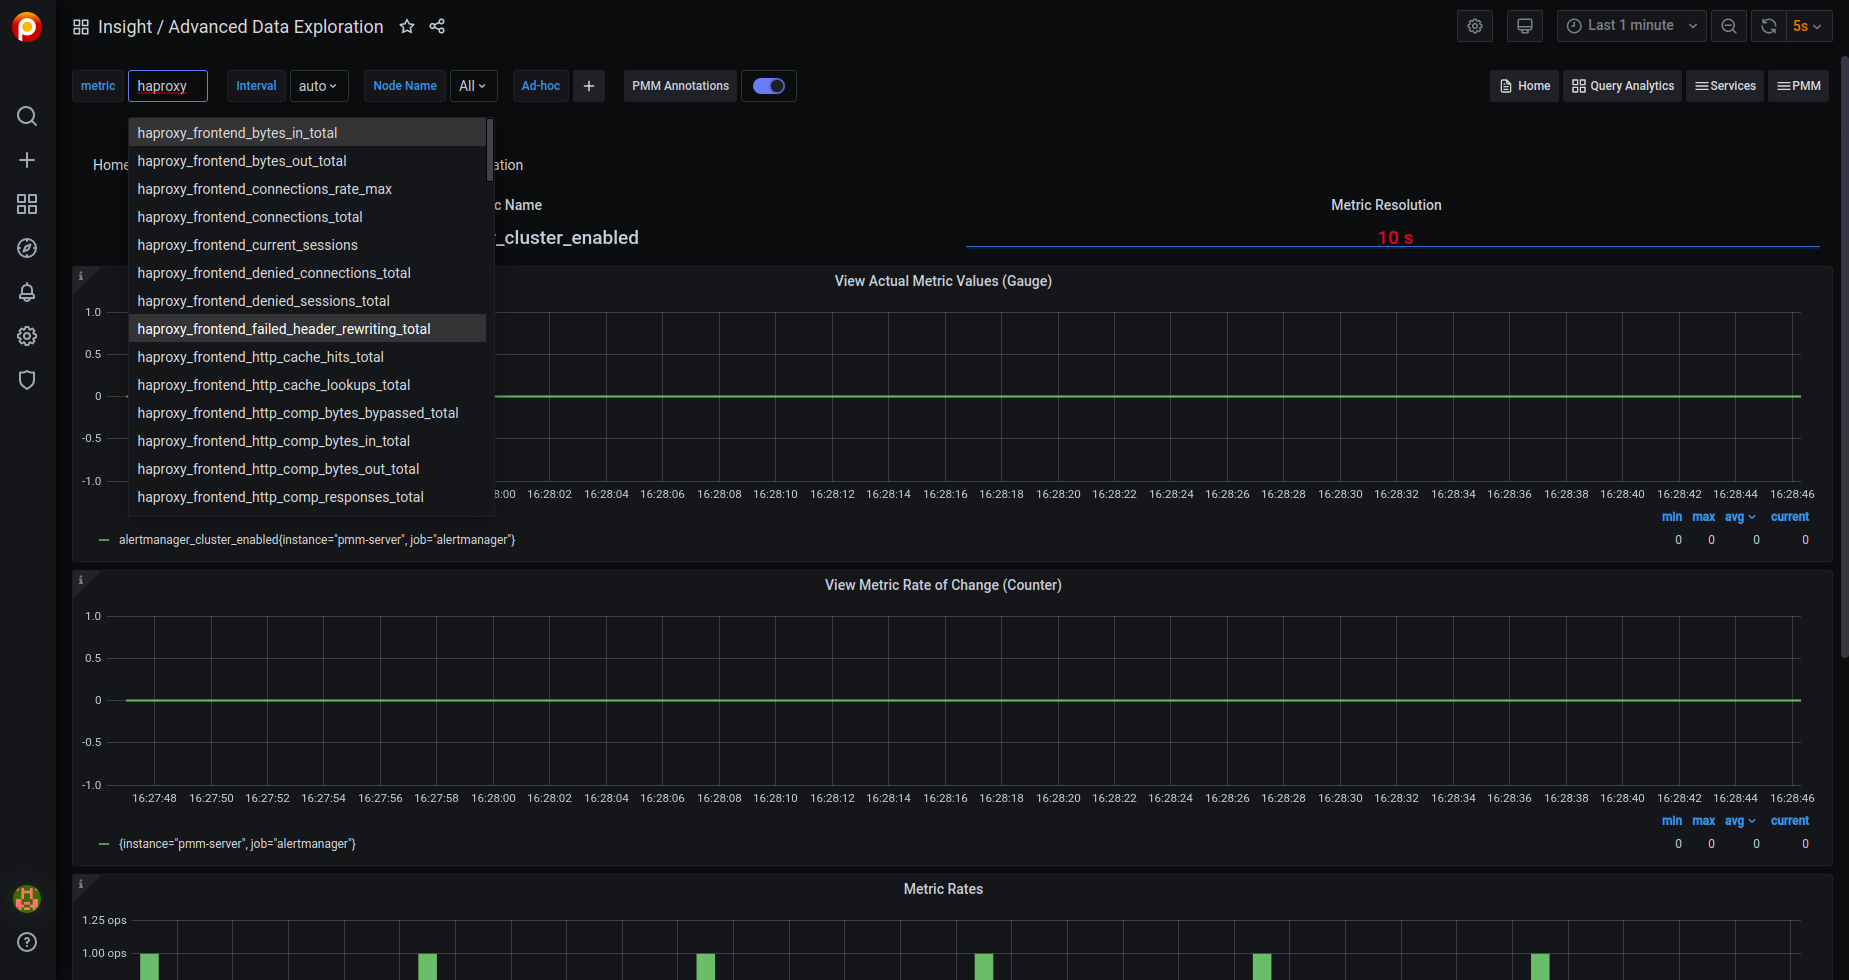
HAProxy data is visible in the Advanced Data Exploration dashboard:

Get expert help
If you need assistance, visit the community forum for comprehensive and free database knowledge, or contact our Percona Database Experts for professional support and services.