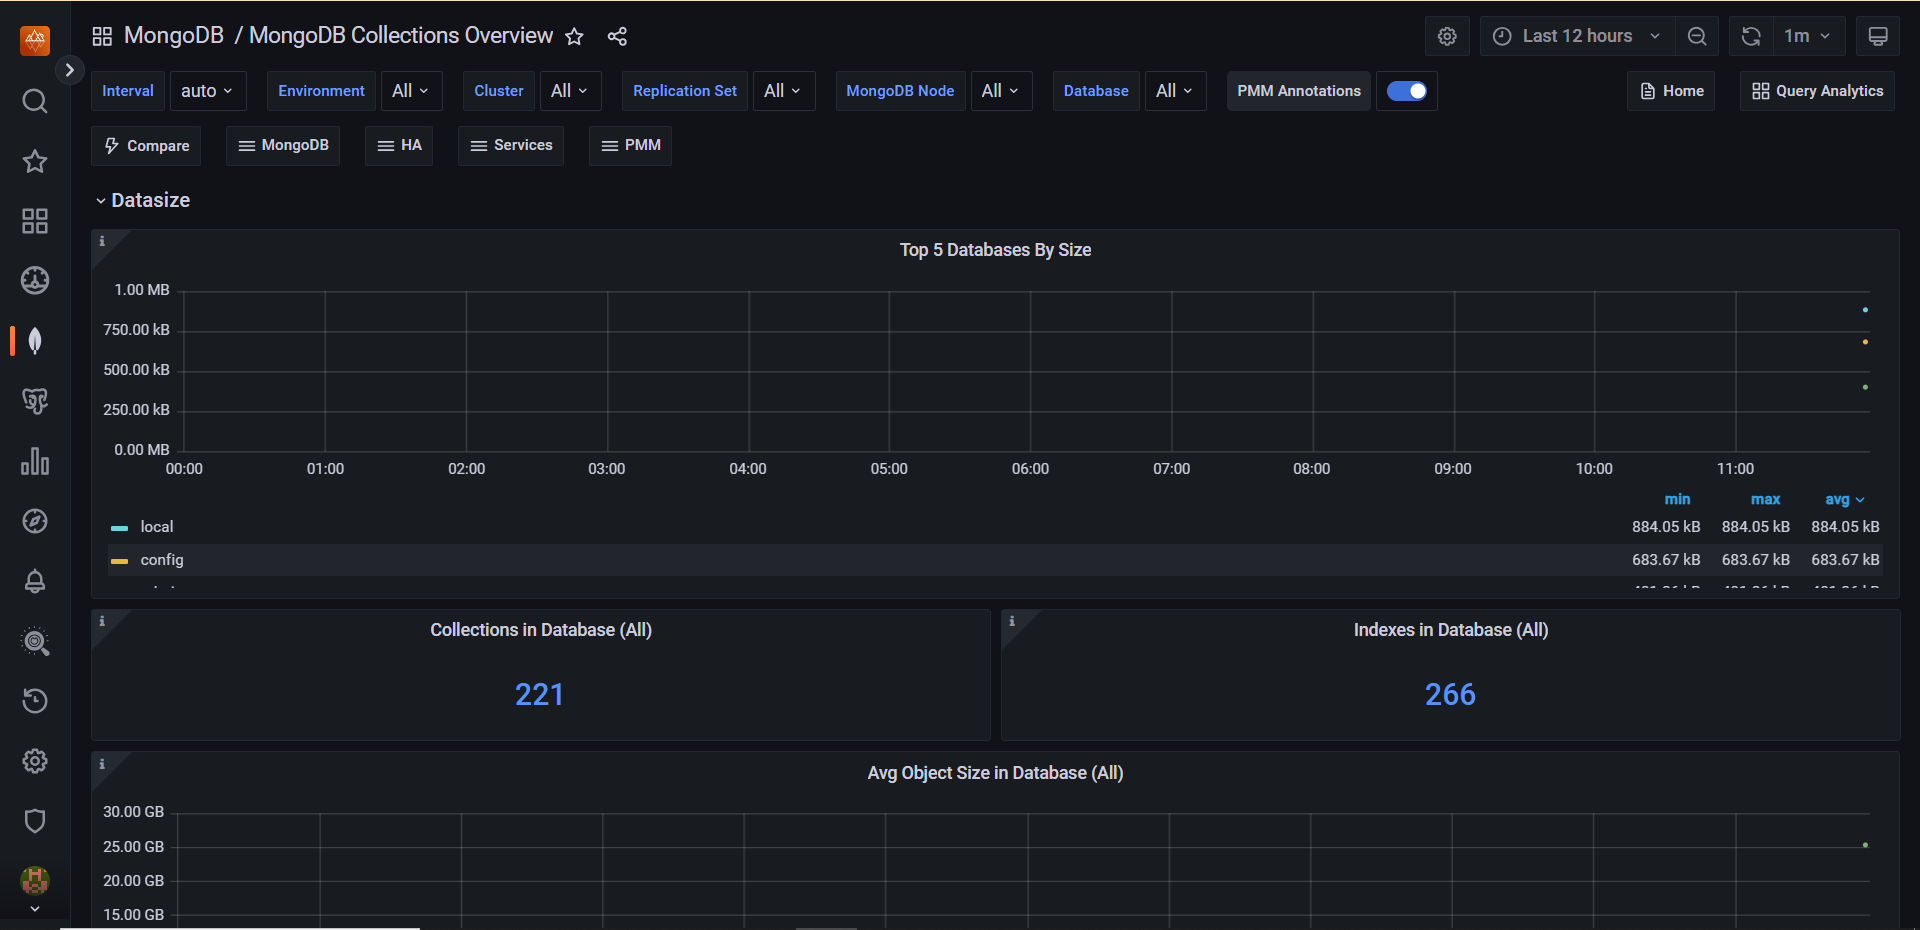
MongoDB Collections Overview
This realtime dashboard contains panels of data about the Hottest Collections in the MongoDB database.
The Instance level includes two panels, one for the Hottest Collections by Read (Total) and the Hottest Collections by Write (total).
The next panel displays data at the Database Level, where you can view MongoDB metrics such as Commands, Inserts, Updates, Removes, and Getmore.
The last panel shows the number of operations in the chosen database.

Get expert help
If you need assistance, visit the community forum for comprehensive and free database knowledge, or contact our Percona Database Experts for professional support and services.