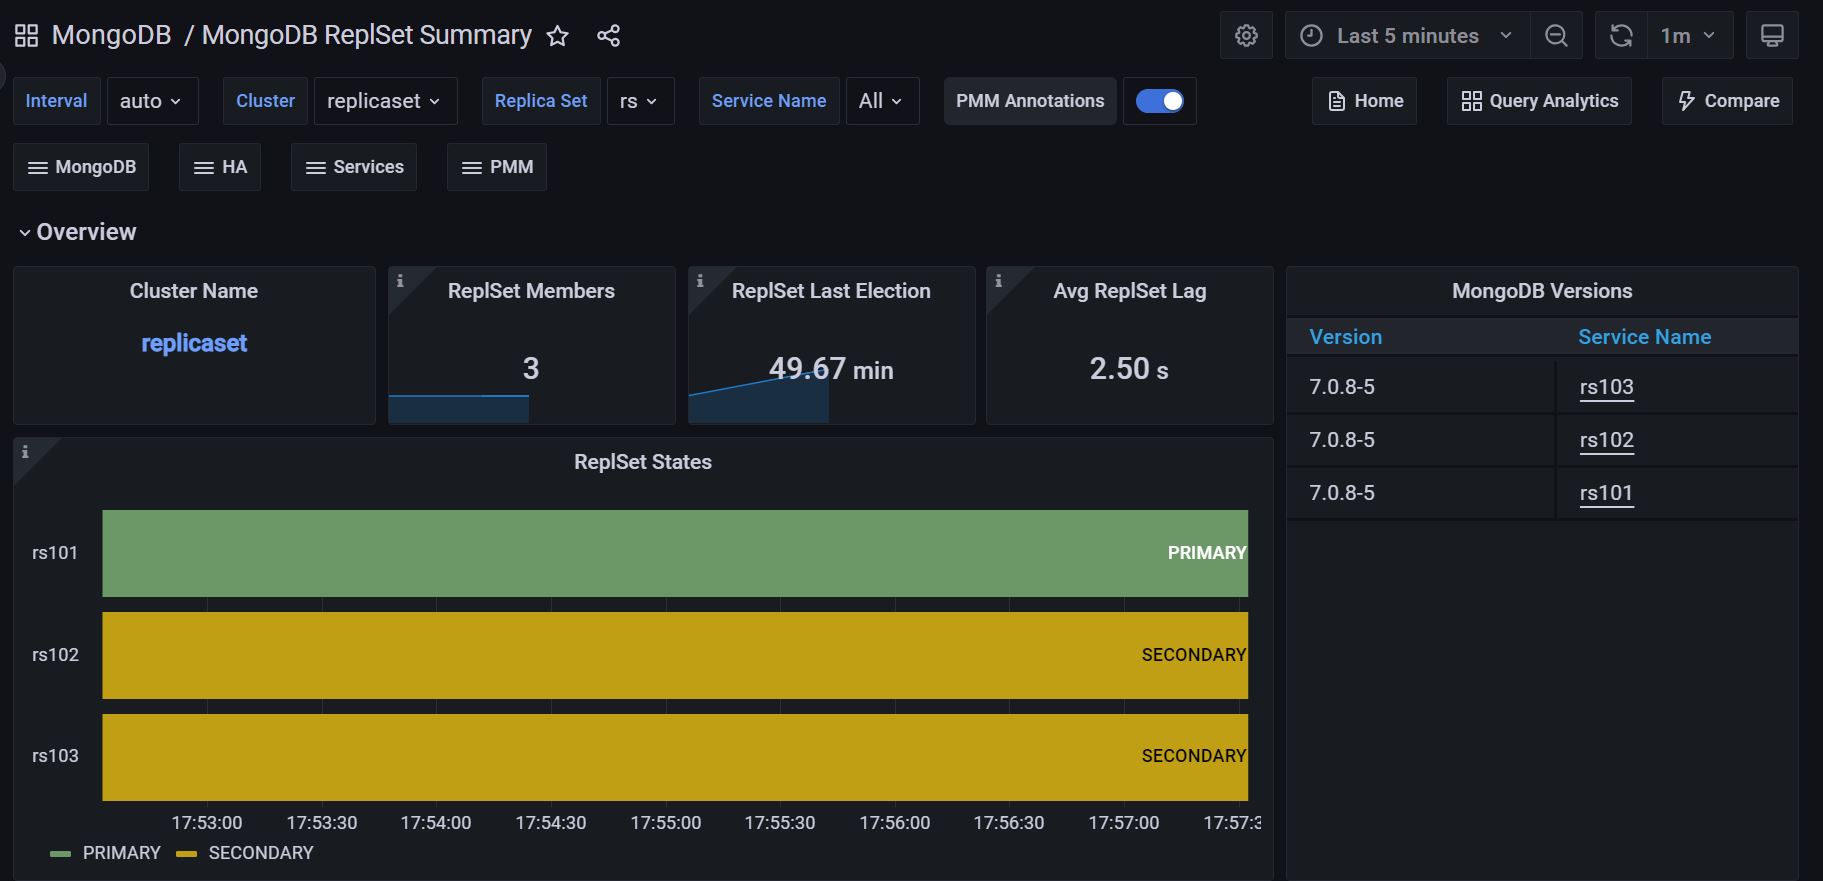
MongoDB ReplSet Summary (OLD)
Dashboard update notice
A new version of the MongoDB ReplSet Summary dashboard is available. This older version will be deprecated and removed from PMM in the near future. We encourage you to start using the new dashboard to benefit from its enhanced monitoring capabilities.

Replication Lag
MongoDB replication lag occurs when the secondary node cannot replicate data fast enough to keep up with the rate that data is being written to the primary node. It could be caused by something as simple as network latency, packet loss within your network, or a routing issue.
Operations - by service name
Operations are classified by legacy wire protocol type (insert, update, and delete only).
Max Member Ping Time - by service name
This metric can show a correlation with the replication lag value.
Max Heartbeat Time
Time span between now and last heartbeat from replicaset members.
Elections
Count of elections. Usually zero; 1 count by each healthy node will appear in each election. Happens when the primary role changes due to either normal maintenance or trouble events.
Oplog Recovery Window - by service name
Timespan ‘window’ between newest and the oldest op in the Oplog collection.
Get expert help
If you need assistance, visit the community forum for comprehensive and free database knowledge, or contact our Percona Database Experts for professional support and services.